Return to flip book view
June 2025Portfolio Manager: Brian C. MarkPeriod HDY Gross HDY NetRussell 1000 Value IndexMorningstar US Dividend IndexLast Month 1.90% 1.84% 3.42% 1.87%Trailing 3-Months 0.86% 0.70% 3.79% (3.44%)1-Year 15.85% 15.11% 13.70% 6.75%3-Year 9.17% 8.47% 12.76% 6.54%5-Year10.89% 10.18% 13.93% 8.78%7-Year 8.99% 8.29% 9.59% 7.87%10-Year 9.13% 8.43% 9.19% 8.95%15-Year 8.61% 7.91% 11.57% 11.68%Since Inception 7.44% 6.75% 7.20% 6.41%Year HDY Gross HDY NetRussell 1000 Value IndexMorningstar US Dividend Index2003 13.0% 12.3% 30.0% 28.7%2004 8.1% 7.4% 16.5% 10.9%2005 4.5% 3.8% 7.1% 4.9%2006 11.1% 10.4% 22.2% 15.8%2007 8.2% 7.5% (0.2%) 5.5%2008 (7.8%) (8.4%) (36.8%) (37.0%)2009 10.8% 10.1% 19.7% 26.5%2010 10.3% 9.6% 15.5% 15.1%2011 6.5% 5.8% 0.4% 2.1%2012 4.8% 4.2% 17.5% 16.0%2013 12.8% 12.1% 32.5% 32.4%2014 5.9% 5.2% 13.5% 13.7%2015 0.1% (0.5%) (3.8%) 1.4%2016 12.0% 11.3% 17.3% 12.0%2017 12.7% 11.9% 13.7% 21.8%2018 1.4% 0.8% (8.3%) 2.5%2019 18.8% 18.1% 26.5% 26.5%2020 2.7% 2.0% 2.8% 0.2%2021 18.8% 18.0% 25.2% 15.8%2022 0.7% 0.1% (7.5%) 2.8%2023 2.9% 2.2% 11.5% 1.2%2024 12.9% 12.2% 14.4% 8.9%2025 8.0% 7.7% 6.0% 1.2%Occidental Petroleum Corporation 3.50%ConocoPhillips 3.50%Becton, Dickinson and Company 3.50%Duke Energy Corporation 3.25%Enbridge Incorporated 3.25%Brookfield Corporation 3.00%Medtronic PLC 3.00%Verizon Communications Inc. 3.00%PepsiCo Inc. 3.00%CME Group Inc. 3.00%Portfolio Company Holdings 342024 Portfolio Turnover 12.3%Beta 0.46Upside Capture Ratio 55.3%Downside Capture Ratio 40.7%Dividend Yield 3.1%Please refer to GIPS® Compliant Presentation for important disclaimers and information. The Morningstar US Dividend Valuation Index is designed to provide exposure to securities in the Morningstar US Market Index that have high dividend yield, strong financial health,and attractive uncertainty-adjusted valuation. The inception date is May 2018. Prior returns used are from the S&P 500 Index. Investing in securities involves risk, including potential loss of principal. No investment strategy can guarantee a profit or protect against loss inperiods of declining values. Please see our ADV 2A Brochure for additional information on the risks associated with our services and for a complete description of advisory fees customarily charged by St. James. The composite positions shown above are a representativesample of holdings in the composite. Not every client’s account will have these exact characteristics. The actual characteristics with respect to any particular account will vary based on a number of factors including but not limited to: (i) the size of the account; and (ii)market prices of individual securities at the time of investment. Dividend yield is weighted average. Portfolio statistics, growth of $100,000 and standard deviation are presented net of fees. Past Performance is not a guarantee of current or future results. Annual ReturnsAnnualized Standard DeviationTop Ten Equity Holdings by Portfolio WeightHigh Dividend Yield Sector Weightings414 Main Street, Suite 205, Port Jefferson, NY 11777 | (800) 966-9343 | info@stjamesia.comPortfolio Characteristics versus Russell 1000 Value IndexValue of $100,000 Invested in June 1999 through June 2025Annualized ReturnsHigh Dividend Yield PortfolioThe St. James High Dividend Yield Portfolio takes a total return approach to dividend investing, seeking attractive current income and capital appreciation through an actively managed portfolioof dividend-paying stocks. The High Dividend Yield Portfolio value-oriented approach invests primarily in companies with above-average dividend yields and trading at reasonable discountsfrom our assessment of their intrinsic value.Minimum Investment: $100,000$85,000$135,000$185,000$235,000$285,000$335,000$385,000$435,000$485,000$535,000199920002001200320042005200620082009201020112013201420152016201820192020202120232024St. James High Dividend Yield Portfolio0.00%2.00%4.00%6.00%8.00%10.00%12.00%14.00%16.00%18.00%20.00%Year 1 Year 3 Year 5 Year 7 Year 10 Year 15 SinceInceptionSt. James High Dividend Yield Russell 1000 Value Index17.00%15.75%12.75%10.25%9.50%7.50%6.00%5.75%5.00%4.25%2.50%2.00%1.75%Health CareFinancialsConsumer StaplesEnergyIndustrialsUltrashort Fixed-IncomeCommunication ServicesUtilitiesMaterialsInformation TechnologyReal EstateConsumer DiscretionaryCash
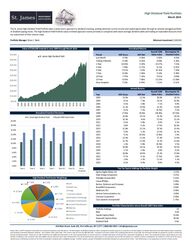
High Dividend Yield PortfolioJune 2025Please refer to GIPS® Compliant Presentation for important disclaimers and information. No investment strategy can guarantee a profit or protect against loss in periods of declining values. Please see our ADV 2A Brochure for additional information on the risks associated with our services and for acomplete description of advisory fees customarily charged by St. James. The composite information shown above are a representative sample of holdings in the composite. Not every client’s account will have these exact characteristics. The actual characteristics with respect to any particular accountwill vary based on a number of factors including but not limited to: (i) the size of the account; and (ii) market prices of individual securities at the time of investment. Portfolio statistics and performance returns are presented net of fees. Past Performance is not a guarantee of current or futureresults. 414 Main Street - Suite 205, Port Jefferson, NY 11777 | (800) 966-9343 | info@stjamesia.comValue of $100,000 Invested in June 1999 through June 2025Calendar Year Total Returns - Focused on Long-Term Capital ProtectionRisk versus ReturnPortfolio Performance In Different Market Environments - Number of MonthsPortfolio Performance In Different Market EnvironmentsCurrent Inflation Surge St. James: 23.6%RLV: 24.9%Financial Crisis St. James: 8.2%Russell 1000 Value: -25.5%Tech Bubble St. James: 9.3%Russell 1000 Value: 14.7%-60%-50%-40%-30%-20%-10%0%1999 2000 2001 2003 2004 2005 2006 2008 2009 2010 2011 2013 2014 2015 2016 2018 2019 2020 2021 2023 2024Russell 1000 Value Index Drawdown High Dividend Yield Portfolio Drawdown1824198502338391117055050100150200250Severe Declines Trending Down Trading Range Trending Up Frothy AdvancesSt. James High Dividend Yield Portfolio Russell 1000 Value Index-2.5%-2.0%0.4%1.8%3.5%-7.3%-3.0%0.3%3.0%6.7%-10.0%-8.0%-6.0%-4.0%-2.0%0.0%2.0%4.0%6.0%8.0%Index -4% or more Index -2% to - 4% Index of -2% to +2% Index 2% to 4% Index +4% or moreSt. James High Dividend Yield Portfolio Russell 1000 Value Index5.00%5.60%6.20%6.80%7.40%0.00% 5.00% 10.00% 15.00% 20.00%Annualized ReturnsAnnualized Standard DeviationSt. James High Dividend Yield Portfolio Russell 1000 Value$0$100,000$200,000$300,000$400,000$500,000$600,000$700,0001999 2000 2001 2003 2004 2005 2006 2008 2009 2010 2011 2013 2014 2015 2016 2018 2019 2020 2021 2023 2024Russell 1000 Value Index St. James High Dividend Yield Portfolio
High Dividend Yield PortfolioJune 2025Please refer to GIPS® Compliant Presentation for important disclaimers and information. Investing in securities involves risk, including potential loss of principal. No investment strategy can guaranteInvesting in securities involves risk, including potentialloss of principal. No investment strategy can guarantee a profit or protect against loss in periods of declining values. Please see our ADV 2A Brochure for additional information on the risks associated with our services and for a complete description ofadvisory fees customarily charged by St. James. The composite information shown above are a representative sample of holdings in the composite. Not every client’s account will have these exact characteristics. The actual characteristics with respect toany particular account will vary based on a number of factors including but not limited to: (i) the size of the account; and (ii) market prices of individual securities at the time of investment. Dividend yield and 10-Year dividend gowth is weighted averageand for equity holdings only. *Dividend growth and growing income results are net of fees. Past Performance is not a guarantee of current or future results. Dividend Paying Companies Have Historically Provided A Growing Source Of Income414 Main Street - Suite 205, Port Jefferson, NY 11777 | (800) 966-9343 | info@stjamesia.comDISCIPLINED DIVIDEND VALUE STRATEGYInfluencedby the teachings of Benjamin Graham and Warren Buffett. The High Dividend Yield Portfolio invests with a long-term value perspective, seekingoutcompaniesthat trade at significant discounts to our estimate of their intrinsic value. The High Dividend Yield Portfolio emphasizes quality companiesand,importantly,downside protection which is critical to long-term success.Participateand Strive to Preserve: Emphasizes quality companies and,importantly,resilienceduring market setbacks and participation during upturns have been key featuresoftheportfolio.Long-Term Approach: Resiliency through market cycles is critical to long-term success.Focus: Dividend Paying Equities with attractive dividend yields, dividend growth andtradingatattractive valuations.Independence: Employee owned and operated.Weare professional portfolio managers Committed to Value Investing. Our investment methodology blends fundamental analysis, discipline, and patiencetocreateattractive long-term returns based on the time-proven principles of value investing, while avoiding permanent impairment of capital.Results: Strive to outperform the market averages over afullmarket cycle while keeping emphasis on low risk.DividendYield and Dividend Growth: The portfolioinvestsincompanies with solid dividends and attractivedividendgrowth. These high-quality companies havedisplayeddurablebusiness models, stable earnings,solidfundamentals,and strong histories of profit andgrowth,whichgenerally perform well under a wide range ofmarketconditions.Year 1 Year 2 Year 3 Year 4 Year 5 Year 6 Year 7 Year 8 Year 9 Year 10Dividend Growth$3,080 $3,308 $3,553 $3,816 $4,099 $4,403 $4,729 $5,080 $5,456 $5,860Growing Income$3,080 $6,388 $9,941 $13,758 $17,857 $22,260 $26,989 $32,069 $37,525 $43,386$0$5,000$10,000$15,000$20,000$25,000$30,000$35,000$40,000$45,000$50,000$0$1,000$2,000$3,000$4,000$5,000$6,000$7,000GROWING INCOME >>GROWING DIVIDEND >>Initial Investment: $100,000St. James Initial Dividend Yield: 3.10%*St. James 10-Year Asset Weighted Annual Dividend Growth: 7.41%
Gross- Net- Benchmark Composite Benchmark Number of Internal Value of Total Total Firmof-Fees of-Fees Index 3-Year 3-Year Accounts in Composite Composite Stategy AssetsReturn Return Return StDev (%) StDev (%) Composite Dispersion (millions) Assets ($M)** (millions)* 1999 27.53% 27.07% 13.56% n/a n/a ≤ 5 n/a $0.12 - $2.72000 -2.74% -3.37% 7.01% n/a n/a ≤ 5 n/a $0.41 - $4.42001 -2.29% -2.92% -5.59% n/a n/a ≤ 5 n/a $1.56 - $6.42002 -0.87% -1.51% -15.52% 15.52% 17.22% ≤ 5 n/a $2.47 - $34.12003 13.04% 12.32% 30.03% 12.42% 16.22% ≤ 5 n/a $2.72 - $41.32004 8.07% 7.38% 16.49% 5.80% 14.97% ≤ 5 n/a $2.88 - $45.22005 4.51% 3.84% 7.05% 5.06% 9.59% 6 0.50% $4.48 - $60.42006 11.07% 10.36% 22.25% 4.81% 6.78% 10 3.05% $6.19 - $92.52007 8.17% 7.47% -0.17% 4.47% 8.17% 11 2.41% $7.20 - $76.32008 -7.81% -8.41% -36.85% 5.26% 15.58% 16 2.15% $10.43 - $114.12009 10.84% 10.13% 19.69% 6.70% 21.40% 40 3.57% $19.61 - $220.42010 10.26% 9.55% 15.51% 7.46% 23.51% 44 3.35% $27.41 - $504.72011 6.53% 5.85% 0.39% 7.26% 20.98% 50 1.31% $23.68 - $1,063.42012 4.85% 4.17% 17.51% 6.36% 15.73% 62 1.99% $27.58 - $1,281.42013 12.83% 12.11% 32.53% 5.71% 12.88% 56 1.92% $11.41 - $1,411.22014 5.91% 5.23% 13.45% 5.49% 9.33% 86 0.96% $19.28 - $1,461.52015 0.10% -0.54% -3.83% 6.05% 10.83% 148 0.51% $30.31 - $1,268.82016 12.01% 11.29% 17.34% 6.73% 10.93% 178 0.11% $40.70 - $73.82017 12.66% 11.94% 13.66% 5.99% 10.34% 215 0.69% $52.50 - $78.32018 1.41% 0.75% -8.27% 6.75% 10.98% 245 0.41% $57.10 - $92.72019 18.84% 18.08% 26.54% 6.61% 12.02% 271 1.25% $76.28 - $152.12020 2.70% 2.03% 2.80% 12.15% 19.90% 285 0.69% $76.43 - $185.22021 18.76% 18.00% 25.16% 12.28% 19.33% 303 0.64% $103.40 $227.92 $287.42022 0.74% 0.09% -7.54% 14.37% 21.55% 80 0.26% $24.42 $307.24 $375.32023 2.87% 2.21% 11.46% 11.76% 16.74% 81 0.23% $24.47 $338.29 $414.22024 12.92% 12.20% 14.37% 11.64% 16.89% 27 0.23% $11.18 $355.57 $430.22025 8.02% 7.67% 6.00% 11.11% 15.88% 28 0.15% $12.35 $395.72 $482.7*June 1999 InceptionHigh Dividend Yield Portfolio GIPS® Compliant PresentationSchedule of Comparative Performance Statistics (June 30, 2025)St. James Investment Advisors (St. James) claims compliance with the Global Investment Performance Standards (GIPS®) and has prepared and presented this report in compliance withthe GIPS standards. St. James has been independently verified for the periods July 1, 2016 through December 31, 2024. The verification report is available upon request. A firm thatclaims compliance with the GIPS standards must establish policies and procedures for complying with all the applicable requirements of the GIPS standards. Verification providesassurance on whether the firm’s policies and procedures related to composite and pooled fund maintenance, as well as the calculation, presentation, and distribution of performance,have been designed in compliance with the GIPS standards and have been implemented on a firm-wide basis. Verification does not provide assurance on the accuracy of any specificperformance report.Firm & Composite Information: St. James is an independent investment management firm that manages equity and balanced portfolios. The firm invests primarily in U.S. stocks, bonds,exchange traded funds (ETFs), mutual funds and cash or cash equivalents. The High Dividend Yield Portfolio Composite invests in dividend paying common stocks but has the potential tohold fixed income, cash and/or cash equivalents and expects to remain invested in stock market investments at all times. The High Dividend Yield Portfolio Composite was created in July2006 and has an inception date of June 1999. Performance shown prior to July 2016 represents results achieved by Brian Mark while he was part of St. James Investment Company, acompany he founded in 1999. The firm’s list of composite descriptions is available upon request.Benchmark: The benchmark is the Russell 1000 Value Index, measures the performance of the large-cap value segment of the US equity universe. The Russell 1000 Value Index isconstructed to provide a comprehensive and unbiased barometer for the large-cap value segment. The index is completely reconstituted annually to ensure new and growing equities areincluded and that the represented companies continue to reflect value characteristics. The volatility of Russell 1000 Value Index may be materially different from that of the strategydepicted, and the holdings in the strategy may differ significantly from the securities that comprise the Russell 1000 Value Index. The Russell 1000 Value Index is calculated on a total returnbasis with dividends reinvested and is not assessed a management fee. All historical benchmark returns shown are those of the Russell 1000 Value Index. The comparison of results to anindex does not disclose all facts materially relevant to the comparison.Performance Calculations: Valuations and returns are computed and stated in U.S. dollars. Gross of fees returns are calculated gross of management and custodial fees and net oftransaction costs. Effective January 2019, all Net of fees returns presented are model Net of fees returns where Gross of fees returns are reduced on a monthly basis by 1/12th that is equalto the highest investment management fees charged to intended clients of the High Dividend Yield Portfolio (0.65% per annum). Gross of fees returns are calculated gross of all withholdingtaxes on foreign dividends. Accruals for fixed income and equity securities are included in calculations. Returns in this presentation include reinvestment of all income.Effective January 2021, the maximum management fee for the High Dividend Yield Portfolio strategy is 0.65% per annum. Additional information regarding St. James' fees is included in Part2 of it's Form ADV. Internal dispersion is calculated using the asset-weighted standard deviation of the gross returns of all accounts included in the composite for the entire year; it is notpresented for periods less than one year or when there were five or fewer portfolios in the composite for the entire year. The three-year annualized standard deviation measures thevariability of the composite gross returns and the benchmark returns over the preceding 36-month period. This presentation does not disclose the effect of material or economic conditionson the results portrayed. Some portfolios in the composite pay zero commissions. Policies for valuing investments, calculating performance, and preparing GIPS reports are available uponrequest.**Effective 2021, Total Strategy Assets include composite accounts assets and unified managed accounts assets, which are presented as supplemental information.Past performance does not guarantee future results. GIPS® is a registered trademark of CFA Institute. CFA Institute does not endorse or promote this organization, nor does it warrantthe accuracy or quality of the content contained herein.