Return to flip book view
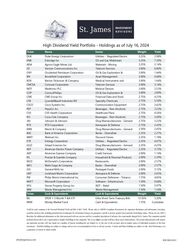
Ticker Sector Weight YieldCOP ConocoPhillips Oil & Gas Exploration & Production3.50% 3.77%DUK Duke Energy Corporation Utilities - Regulated Electric3.25% 3.61%ENB Enbridge Inc. Oil and Gas Midstream3.25% 6.34%OXYOccidental Petroleum Oil & Gas Exploration & Production3.25% 2.66%BDX Becton Dickinson & Company Medical Instruments and Supplies3.25% 1.98%AEM Agnico Eagle Mines Ltd. Materials - Mining3.00% 1.60%VZ Verizon Communications Inc. Telecom Services3.00% 6.43%BN Brookfield Corporation Asset Management3.00% 0.81%CMCSA Comcast Corporation Telecom Services3.00% 4.02%MDT Medtronic PLC Medical Devices3.00% 3.42%JNJ Johnson & Johnson Drug Mananufacturers - General3.00% 3.31%PEP PepsiCo Inc. Beverages - Non-Alcoholic3.00% 3.86%CME CME Group Inc Financial Data and Stock Exchanges2.75% 4.23%LYB LyondellBasell Industries NV Specialty Chemicals2.75% 10.07%CSCO Cisco Systems Inc. Communication Equipment2.75% 3.08%KO Coca-Cola Company Beverages - Non-Alcoholic2.75% 2.98%RTX RTX Corporation Aerospace & Defense2.75% 2.09%MRK Merck & Company Drug Mananufacturers - General2.75% 4.10%SCHW Charles Scwhab Corp. Financial Services2.75% 1.54%PM Philip Morris International Inc. Consumer Defensive - Tobacco2.75% 3.62%UNP Union Pacific Corp. Industrials - Railroads2.50% 2.57%SPG Simon Property Group Inc. REIT - Retail2.50% 5.98%GILD Gilead Sciences Inc. Drug Mananufacturers - General2.50% 3.06%AEPAmerican Electric Power Utilities - Regulated Electric2.50% 3.67%BAC Bank of America Corporation Banks - Diversified2.50% 2.97%WFC Wells Fargo & Company Banks - Diversified2.25% 2.58%GIS General Mills Inc. Packaged Foods2.25% 4.23%WM Waste Management Inc. Waste Management2.25% 1.52%CVS CVS Health Corporation Healthcare Plans2.25% 3.93%AXP American Express Company Credit Services2.00% 1.42%PG Procter & Gamble Company Household & Personal Products2.00% 2.67%MCD McDonald's Corporation Restaurants2.00% 2.36%LMT Lockheed Martin Corporation Aerospace & Defense2.00% 2.98%MSFT Microsoft Corporation Software - Infrastructure1.50% 0.94%Ticker Cash & Equivalents Weight YieldBIL Ultra Short-Term Treasury Bills7.75% 4.13%MMF Cash & Equivalents1.75% CustodianHigh Dividend Yield Portfolio - Holdings as of April 8, 2025NameYield for each company is the Forward Dividend Yield and BIL is SEC Yield. Please refer to GIPS® Compliant Presentation for important disclaimers and information. Investing insecurities involves risk, including potential loss of principal. No investment strategy can guarantee a profit or protect against loss in periods of declining values. Please see our ADV 2ABrochure for additional information on the risks associated with our services and for a complete description of advisory fees customarily charged by St. James. The composite portfoliopositions shown above are a representative sample of holdings in the composite. Not every client’s account will have these exact characteristics. The actual characteristics with respect to anyparticular account will vary based on a number of factors including but not limited to: (i) the size of the account; and (ii) market prices of individual securities at the time of investment.Portfolio holdings are subject to change and are not a recommendation to buy or sell any security. Current and future holdings are subject to risk. Past Performance is not a guarantee ofcurrent or future results. Cash & EquivalentsSPDR 1-3 Month T-Bill ETFMoney Market Fundinfo@stjamesia.com www.stjamesia.com 800.966.9343