Return to flip book view
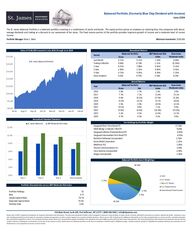
Balanced PortfolioJune 2025Portfolio Manager: Brian C. MarkGross NetLast Month 1.29% 1.23% 2.76% 2.92%Trailing 3-Months 0.90% 0.73% 5.47% 7.04%1-Year 11.14% 10.43% 10.46% 12.31%3-Year 7.00% 6.31% 8.80% 9.80%5-Year 6.41% 5.73% 5.54% 7.28%Since Inception 6.04% 5.36% 5.74% 6.90%Gross Net2016 2.0% 1.7% 1.3% 2.9%2017 7.7% 7.1% 11.8% 15.1%2018 0.4% (0.2%) (3.7%) (5.2%)2019 15.4% 14.7% 15.7% 18.6%2020 3.5% 2.9% 10.4% 12.2%2021 10.5% 9.8% 7.1% 9.4%2022 (5.0%) (5.6%) (14.4%) (15.0%)2023 5.2% 4.5% 12.4% 12.7%2024 10.7% 10.0% 8.0% 8.5%2025 5.1% 4.8% 6.6% 7.2%Vanguard Short-Term Bond ETF 15.75%SPDR Bloomberg 1-3 Month T-Bill ETF8.00%Vanguard Inflation-Protected Bond ETF8.00%Vanguard Intermediate-Term Bond ETF6.50%Berkshire Hathaway Inc. 2.50%Enbridge Inc. 2.25%Exxon Mobil Corporation 2.25%Verizon Communications Inc. 2.00%Cisco Systems Inc. 2.00%Amgen Inc. 2.00%Portfolio Holdings 34Beta 0.72Upside Capture Ratio80.3%Downside Capture Ratio 70.5%Portfolio Yield 3.3%Please refer to GIPS® Compliant Presentation for important disclaimers and information. The Dow Jones Moderate Portfolio Index is designed to measure a total portfolio of stocks, bonds, and cash, allocated to represent aninvestor's desired risk profile. Investing in securities involves risk, including potential loss of principal. No investment strategy can guarantee a profit or protect against loss in periods of declining values. Please see our ADV2A Brochure for additional information on the risks associated with our services and for a complete description of advisory fees customarily charged by St. James. The composite positions shown above are a representativesample of holdings in the composite. Not every client’s account will have these exact characteristics. The actual characteristics with respect to any particular account will vary based on a number of factors including but notlimited to: (i) the size of the account; and (ii) market prices of individual securities at the time of investment. Portfolio yield is weighted average. Portfolio statistics, growth of $100,000 and standard deviation are presentednet of fees. Past Performance is not a guarantee of current or future results. The St. James Balanced Portfolio is a balanced portfolio investing in a combination of stocks and bonds. The equity portion places an emphasis on selecting blue chip companies with above-average dividends and trading at a discount to our assessment of fair value. The fixed income portion of the portfolio provides long-term growth of income and a moderate level of currentincome. Value of $100,000 Invested in July 2016 through June 2025Annualized Standard DeviationAnnual ReturnsAnnualized ReturnsMinimum Investment: $100,000Dow Jones Moderate IndexDow Jones Moderate IndexPeriodYearBalanced PortfolioBalanced Portfolio414 Main Street, Suite 205, Port Jefferson, NY 11777 | (800) 966-9343 | info@stjamesia.comPortfolio Characteristics versus S&P Moderate Risk IndexBalanced Portfolio Asset WeightingsS&P Moderate Risk IndexS&P Moderate Risk IndexTen Holdings by Portfolio Weight$95,000$105,000$115,000$125,000$135,000$145,000$155,000St. James Balanced Portfolio45.75%41.00%6.25%5.25%1.75%U.S. Fixed-IncomeU.S. StocksNon-U.S. StocksInternational Fixed-IncomeCash0%2%4%6%8%10%12%Year 1 Year 3 Year 5 Since InceptionSt. James Balanced S&P Moderate Risk Index
Gross- Net- Benchmark Composite Benchmark Number of Internal Value of Total Total Firmof-Fees of-Fees Index 3-Year 3-Year Accounts in Composite Composite Stategy AssetsReturn Return Return StDev (%) StDev (%) Composite Dispersion (millions) Assets ($M)** (millions)* 2016 2.03% 1.70% 1.31% n/a n/a 5 n/a $0.88 - $73.82017 7.75% 7.06% 11.78% n/a n/a 13 1.30% $2.71 - $78.32018 0.44% -0.21% -3.72% n/a n/a 13 0.44% $3.44 - $92.72019 15.44% 14.71% 15.71% 3.94% 4.78% 17 0.44% $4.66 - $152.12020 3.54% 2.87% 10.42% 6.84% 8.02% 35 0.54% $11.20 - $185.32021 10.48% 9.77% 7.12% 6.96% 7.49% 48 0.44% $18.98 $19.98 $287.42022 -4.96% -5.58% -14.41% 9.01% 10.58% 50 0.24% $16.57 $38.07 $375.3*July 2016 Inception2023 5.18% 4.51% 12.41% 8.03% 10.36% 53 0.19% $17.85 $38.02 $414.2*July 2016 Inception2024 10.68% 9.97% 7.97% 8.24% 10.75% 21 0.26% $7.70 $34.27 $430.22025 5.11% 4.77% 6.62% 7.74% 9.70% 22 0.18% $8.31 $43.62 $482.7*July 2016 InceptionBalanced Portfolio GIPS Composite ReportSchedule of Comparative Performance Statistics (June 30, 2025)St. James Investment Advisors (St. James) claims compliance with the Global Investment Performance Standards (GIPS®) and has prepared and presented this report incompliance with the GIPS standards. St. James has been independently verified for the periods July 1, 2016 through December 31, 2024. The verification report is availableupon request. A firm that claims compliance with the GIPS standards must establish policies and procedures for complying with all the applicable requirements of the GIPSstandards. Verification provides assurance on whether the firm’s policies and procedures related to composite and pooled fund maintenance, as well as the calculation,presentation, and distribution of performance, have been designed in compliance with the GIPS standards and have been implemented on a firm-wide basis. Verification doesnot provide assurance on the accuracy of any specific performance report.Firm and Composite Information: St. James is an independent investment management firm that manages equity and balanced portfolios. The firm invests primarily in U.S.stocks, bonds, exchange traded funds, mutual funds and cash or cash equivalents. The Balanced Portfolio Composite invests in dividend paying common stocks and fixed-income,and expects to remain invested in stock market and fixed-income investments at all times. The Balanced Portfolio Composite was created in June 2016 and has an inception dateof July 2016. The firm's list of composite descriptions is available upon request.Benchmark: The benchmark is S&P Target Risk Moderate Index, which is designed to meet the needs of investors who would like to maintain a moderate target level of equityexposure. The S&P Target Risk Moderate Risk Index is designed to measure the performance of moderate stock-bond allocations to fixed income while seekingto increaseopportunities for higher returns through equities. The volatility of the S&P Target Risk Moderate Index may be materially different from that of the strategy depicted, and theholdings in the strategy may differ significantly from the securities that comprise the S&P Target Risk Moderate Index. The S&P Target Risk Moderate Index is calculated on a totalreturn basis and is not assessed a management fee. All historical benchmark returns shown are those of the S&P Target Risk Moderate Index. The comparison of results to anindex does not disclose all facts materially relevant to the comparison.Performance Calculations: Valuations and returns are computed and stated in U.S. dollars. Gross of fees returns are calculated gross of management and custodial fees and net oftransaction costs. Effective January 2019, all Net of fees returns presented are model Net of fees returns where Gross of fees returns are reduced on a monthly basis by 1/12ththat is equal to the highest investment management fees charged to intended clients of the Balanced Portfolio (0.65% per annum). Gross of fees returns are calculated gross of allwithholding taxes on foreign dividends. Accruals for fixed income and equity securities are included in calculations. Returns in this presentation include reinvestment of allincome.Effective January 2021, the maximum management fee for the Balanced Portfolio strategy is 0.65% per annum. Additional information regarding St. James' fees is included in Part2 of it's Form ADV. Internal dispersion is calculated using the asset-weighted standard deviation of the gross returns of all accounts included in the composite for the entire year; itis not presented for periods less than one year or when there were five or fewer portfolios in the composite for the entire year. The three-year annualized standard deviationmeasures the variability of the composite gross returns and the benchmark returns over the preceding 36-month period. This presentation does not disclose the effect of materialor economic conditions on the results portrayed. Some portfolios in the composite pay zero commissions. Policies for valuing investments, calculating performance, and preparingGIPS reports are available upon request.**Effective 2021, Total Strategy Assets include composite accounts assets and unified managed accounts assets, which are presented as supplemental information.Past performance does not guarantee future results.GIPS® is a registered trademark of CFA Institute. CFA Institute does not endorse or promote this organization, nor does it warrant the accuracy or quality of the contentcontained herein.