Return to flip book view
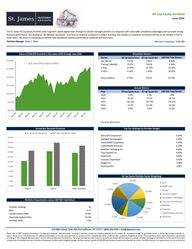
March 2026Portfolio Manager: Brian C. MarkPeriodAll Cap Equity Gross All Cap Equity NetS&P 500 Total ReturnLast Month (4.94%) (5.00%) (4.98%)Trailing 3-Months 1.65% 1.48% 0.74%1-Year 11.12% 10.41% 16.99%3-Year 14.19% 13.46% 21.80%5-Year 10.88% 10.17% 14.19%Since Inception 11.06% 10.36% 14.42%YearAll Cap Equity Gross All Cap Equity NetS&P 500 Total Return2020 2.4% 2.3% 3.8%2021 28.2% 27.4% 28.7%2022 (10.1%) (10.7%) (18.1%)2023 12.3% 11.6% 26.3%2024 14.3% 13.6% 25.0%2025 15.0% 14.2% 17.9%2026 (4.5%) (4.7%) (4.3%)*December 2020 InceptionAlphabet Inc. 6.00%Microsoft Corporation 6.00%Amazon.com Inc. 5.00%Exxon Mobil Corporation 4.75%Berkshire Hathaway Inc. 4.00%JPMorgan Chase & Company 3.50%Meta Platforms Inc. 3.50%Advanced Micro Devices 3.00%Thermo Fisher Scientific Inc. 3.00%Visa Inc. 3.00%Portfolio Holdings2025 Portfolio TurnoverBetaUpside Capture RatioDownside Capture RatioPortfolio Yield24.0%0.79Portfolio Characteristics versus S&P 500 Total ReturnThe St. James All Cap Equity Portfolio seeks long-term capital appreciation through an actively managed portfolio of companies with sustainable competitive advantages and consistentstrong business performance. We emphasize “All-Weather Businesses” and focus on essential companies in today’s economy, but notably on companies we believe will be just asrelevant in five to seven years. We invest in companies we believe have exceptional business performance combined with endurance.Value of $100,000 Invested in December 2020 through March 2026Annualized Standard DeviationAnnual ReturnsAnnualized ReturnsTop Ten Holdings by Portfolio WeightAll Cap Equity Portfolio Sector WeightingsAll Cap Equity PortfolioMinimum Investment: $100,0003386.9%81.9%1.4%414 Main Street, Suite 205, Port Jefferson, NY 11777 | (800) 966-9343 | info@stjamesia.comPlease refer to GIPS® Compliant Presentation for important disclaimers and information. Investing in securities involves risk, including potential loss of principal. No investment strategy can guarantee a profit or protect against loss inperiods of declining values. Please see our ADV 2A Brochure for additional information on the risks associated with our services and for a complete description of advisory fees customarily charged by St. James. The composite positionsshown above are a representative sample of holdings in the composite. Not every client’s account will have these exact characteristics. The actual characteristics with respect to any particular account will vary based on a number offactors including but not limited to: (i) the size of the account; and (ii) market prices of individual securities at the time of investment. Portfolio yield is weighted average. Portfolio statistics, growth of $100,000 and standard deviationare presented net of fees. Past Performance is not a guarantee of current or future results. $95,000$105,000$115,000$125,000$135,000$145,000$155,000$165,000$175,000St. James All Cap Equity Portfolio28.25%20.75%10.00%9.50%9.00%8.25%4.75%3.00%2.25%2.25%2.00%Information TechnologyFinancialsHealth CareCommunication ServicesConsumer DiscretionaryIndustrialsEnergyMaterialsConsumer StaplesReal EstateCash0.00%2.00%4.00%6.00%8.00%10.00%12.00%14.00%16.00%18.00%Year 1 Year 3 Year 5 Since InceptionSt. James All Cap Equity S&P 500 Total Return Index
All Cap Equity Portfolio Composite DisclosureSt. James Investment Advisors (St. James) claims compliance with the Global Investment Performance Standards (GIPS®). GIPS® is a registered trademark of CFAInstitute. CFA Institute does not endorse or promote this organization, nor does it warrant the accuracy or quality of the content contained herein. To obtain a GIPSComposite Report, please call 631-979-6520 or email us at info@stjamesia.com or visit our website at www.stjamesia.com. Past performance does not guaranteefuture results.St. James has been independently verified for the periods July 1, 2016 through December 31, 2025. The verification report is available upon request. A firm that claimscompliance with the GIPS standards must establish policies and procedures for complying with all the applicable requirements of the GIPS standards. Verificationprovides assurance on whether the firm’s policies and procedures related to composite and pooled fund maintenance, as well as the calculation, presentation, anddistribution of performance, have been designed in compliance with the GIPS standards and have been implemented on a firm-wide basis. Verification does not provideassurance on the accuracy of any specific performance report. St. James is an independent investment management firm that manages equity and balanced portfolios.The firm invests primarily in U.S. stocks, bonds, exchange traded funds (ETFs), mutual funds and cash or cash equivalents. The All Cap Equity Portfolio places an emphasison selecting companies with sustainable competitive advantages, consistent strong business performance, and employs a disciplined investment strategy by identifyinghigh quality companies at what it believes to be attractive prices. The investment guidelines of the All Cap Equity Portfolio follow a 95% equity exposure and 5% cashequivalents exposure. Under extreme market conditions, there may be a departure from the basic core guidelines. The All Cap Equity Portfolio Composite was created inNovember 2020 and has an inception date of December 2020. The firm’s list of composite descriptions is available upon request.Benchmark: The benchmark is the S&P 500 Index, which is designed to serve as a portfolio benchmark consisting of quality companies without compromisinginvestment scalability. The S&P 500 Index includes 500 leading companies and captures approximately 80% coverage of available market capitalization. The volatility ofthe S&P 500 Index may be materially different from that of the strategy depicted, and the holdings in the strategy may differ significantly from the securities thatcomprise the S&P 500 Index. The S&P 500 Index is calculated on a total return basis with dividends reinvested and is not assessed a management fee. All historicalbenchmark returns shown are those of the S&P 500 Index. The comparison of results to an index does not disclose all facts materially relevant to the comparison.Performance Calculations: Valuations and returns are computed and stated in U.S. dollars. Gross of fees returns are calculated gross of management and custodial feesand net of transaction costs. Net of fees returns presented are model Net of fees returns where Gross of fees returns are reduced on a monthly basis by 1/12th that isequal to the highest investment management fees charged to intended clients of the All Cap Equity Portfolio (0.65% per annum). Gross of fees returns are calculatedgross of all withholding taxes on foreign dividends. Accruals for fixed income and equity securities are included in calculations. Returns in this presentation includereinvestment of all income. Effective January 2021, the maximum management fee for the All Cap Equity Portfolio strategy is 0.65% per annum. Additional informationregarding St. James' fees is included in Part 2 of it's Form ADV. Internal dispersion is calculated using the asset-weighted standard deviation of the gross returns of allaccounts included in the composite for the entire year; it is not presented for periods less than one year or when there were five or fewer portfolios in the composite forthe entire year. The three-year annualized standard deviation measures the variability of the composite gross returns and the benchmark returns over the preceding 36-month period. This presentation does not disclose the effect of material or economic conditions on the results portrayed. Some portfolios in the composite pay zerocommissions. Policies for valuing investments, calculating performance, and preparing GIPS reports are available upon request.St. James Investment Advisors, LLC is registered as an investment advisor with the United States Securities Exchange Commission ("SEC"). As of March 31, 2026 firmassets were $543,299,727. SEC registration does not constitute an endorsement of the the firm by the SEC nor does it indicate that the advisor has attained a particularlevel of skill or ability.Our investment philosophy reflects the teachings of Benjamin Graham and Warren Buffett. We apply a clearlydefined disciplined approach to Value Investing.Value investing is the process of buying assets for significantly less than the true “intrinsic” or business value to a rationalpurchaser.A consistent, sustainable investment process is vital to weathering all economic climates. The strength of our investmentphilosophy is based on an unwavering commitment to investing in quality businesses.We believe these quality companies possess sustain able competitive advantages, creating value as profitable businessesthat can, over time, provide attractive returns with less risk than the overall market.We maintain a long-term focus and do not attempt to keep pace with all markets. We believe trying to keep pace withthe market in all environments promotes poor decisions and increases the probability of making mistakes.The philosophy that guides the management of our portfolios is built on fundamental analysis and traditional principles.1-800-966-9343 | info@stjamesia.com | www.stjamesia.com